Ethereum has shown resilience in the face of recent market challenges, as evidenced by the consistent positive net flows into the asset’s exchange-traded funds.
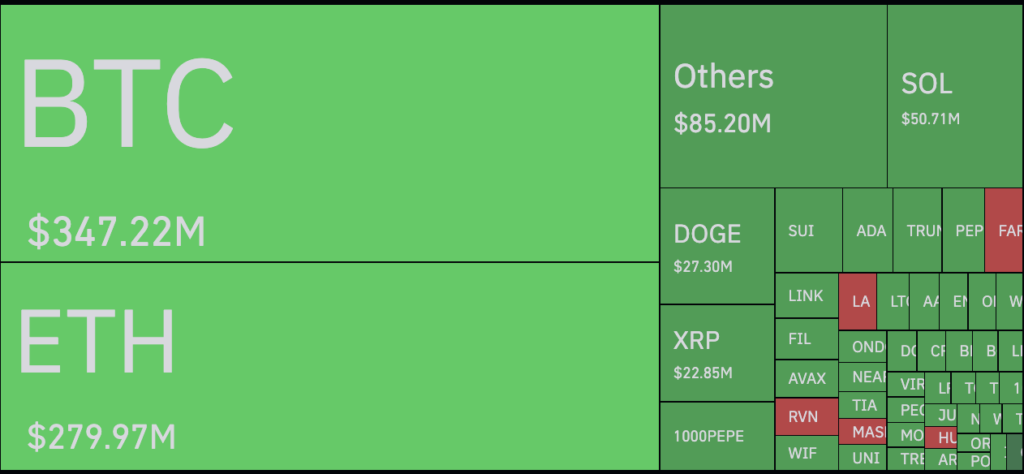
According to data from Farside Investors, daily inflows into spot Ethereum (ETH) ETFs in the U.S. surged to $305.74 million, bringing cumulative inflows to an impressive $1.87 billion.
This substantial growth occurred despite Ethereum price experiencing a 7% decline over the past three days.
These investment products saw their highest cumulative weekly inflow last week. Interestingly, inflows have been consistently positive throughout December, confirming strong institutional interest.
For instance, Dec. 6 recorded $83.76 million in inflows, while Dec. 5 saw an even higher figure of $428.44 million, marking a new ATH in net inflows. The total net assets now stand at $12.46 billion, marking an addition of $1.33 billion in December alone.
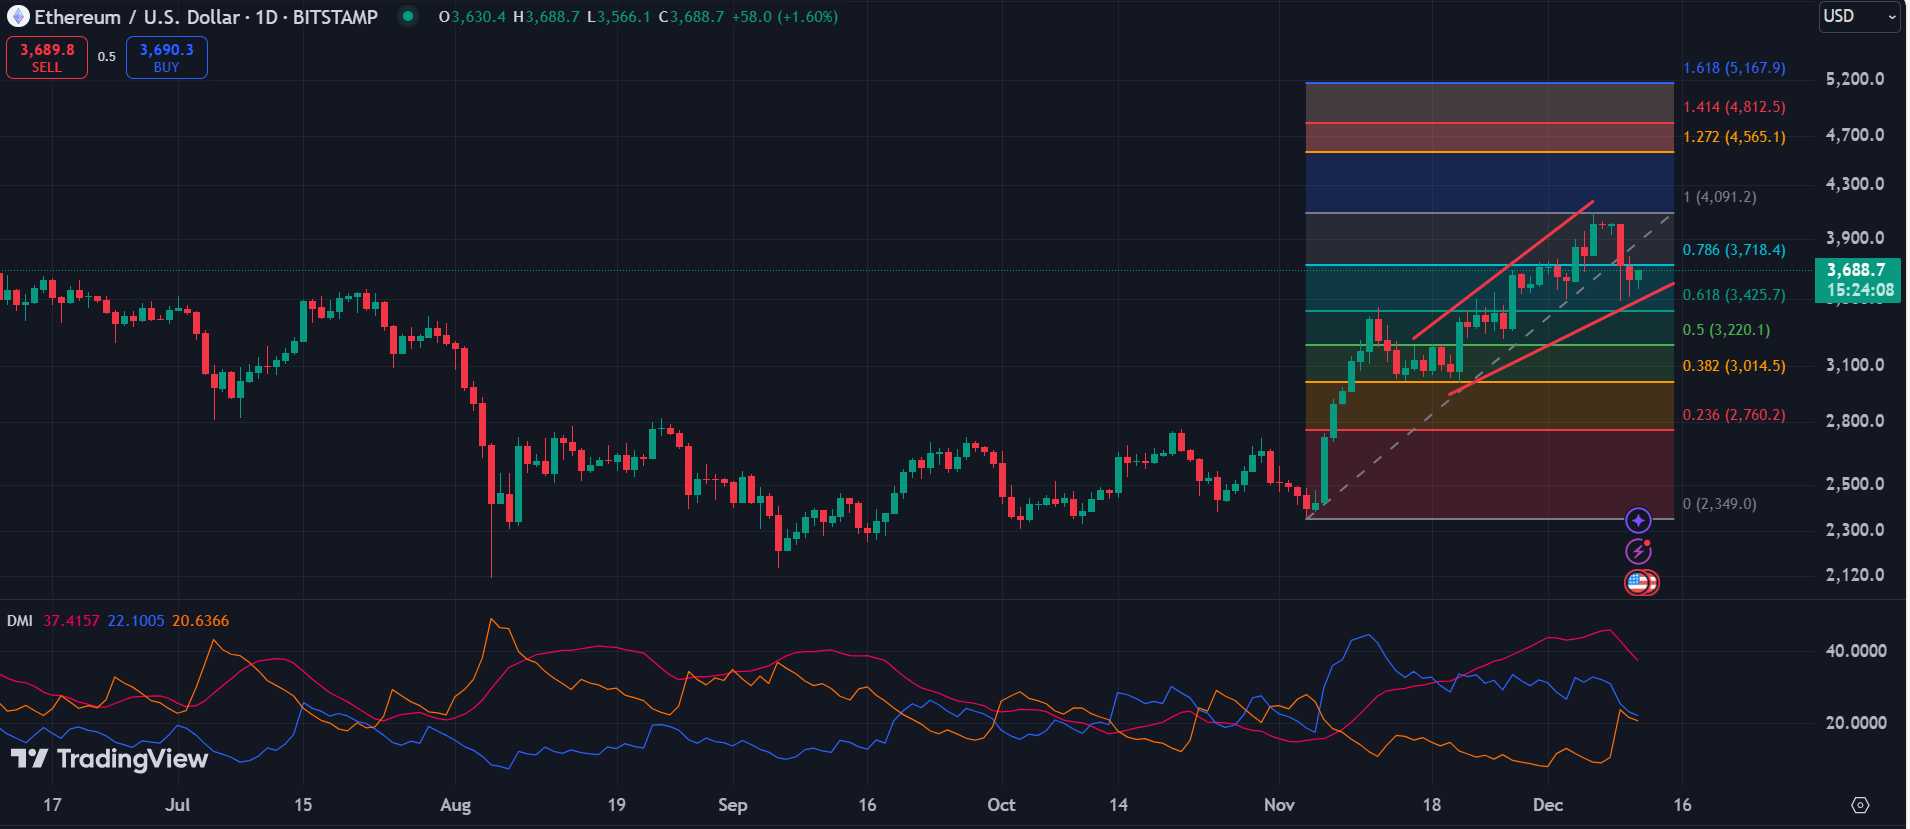
Meanwhile, Ethereum’s price is currently in a delicate position. The asset is trading within an ascending broadening wedge pattern, a formation that typically signals potential volatility.

Ethereum currently trades for $3,688 at the reporting time, down 1.27% over the past 24 hours. Despite the downward action, the altcoin king maintains its position within the wedge.
Notably, the Fibonacci retracement levels show key zones of support and resistance. Ethereum is currently testing the 78.6% level at $3,718. If the price fails to sustain this level, the next support lies at the 61.8% retracement of $3,425.
On the upside, breaking above $3,718 could pave the way for a move toward $4,091, the next critical resistance level.
Further, with the Directional Movement Index, the +DI has dropped to 22.1, while the -DI has risen to 20.6, signaling increasing bearish pressure. Meanwhile, the ADX stands at 37.4. A sustained drop in the +DI alongside a rising -DI could flip the momentum decisively bearish.
Despite these bearish signals, Ethereum’s overall trend remains upward. The ascending wedge pattern’s lower boundary currently acts as a vital support level. A breakdown below this trendline would signal a bearish reversal and could prompt a retest of lower support zones such as $3,220 or $3,014.
Disclosure: This article does not represent investment advice. The content and materials featured on this page are for educational purposes only.


